Observing Weather by Latitude
For this project, we analyzed weather data for an array of randomly selected cities from around the world. We analyzed the results to see if there were any observable trends based on a city's proximity to the equator. The data was pulled from the OpenWeatherMap API, providing real-time data for over 500 cities.
Using Matplotlib, we plotted various observations of weather occurrences by the city's latitude. We specifically looked at Maximum Temperature, Cloudiness, Humidity Percentage, and Wind Speed. This site displays the source data and visualizations created for this analysis. Please enjoy exploring our findings.
Visualizations
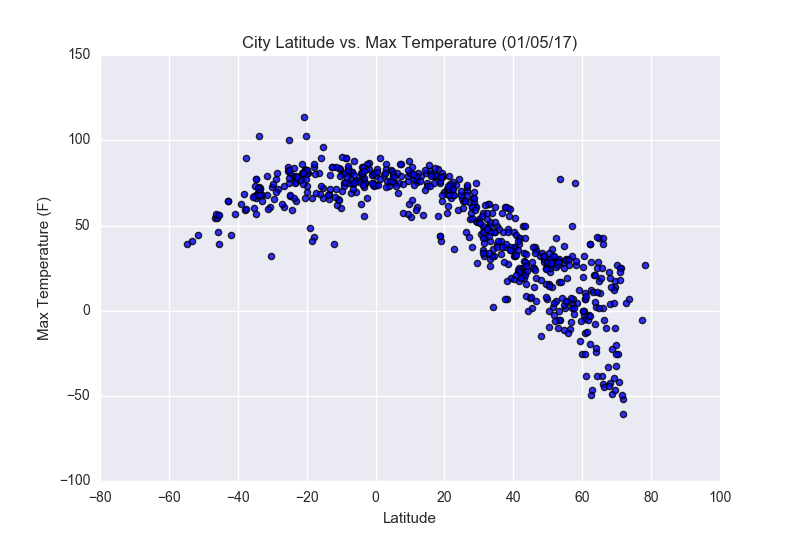
Temperature Map
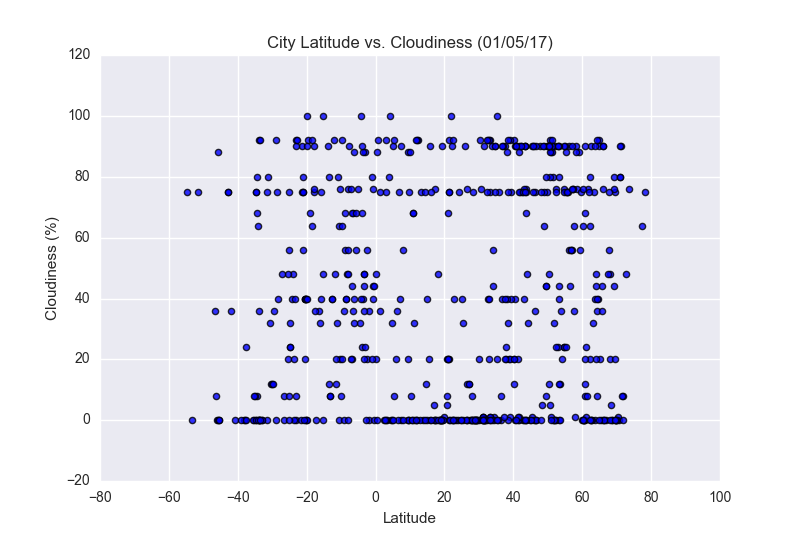
Cloud Map
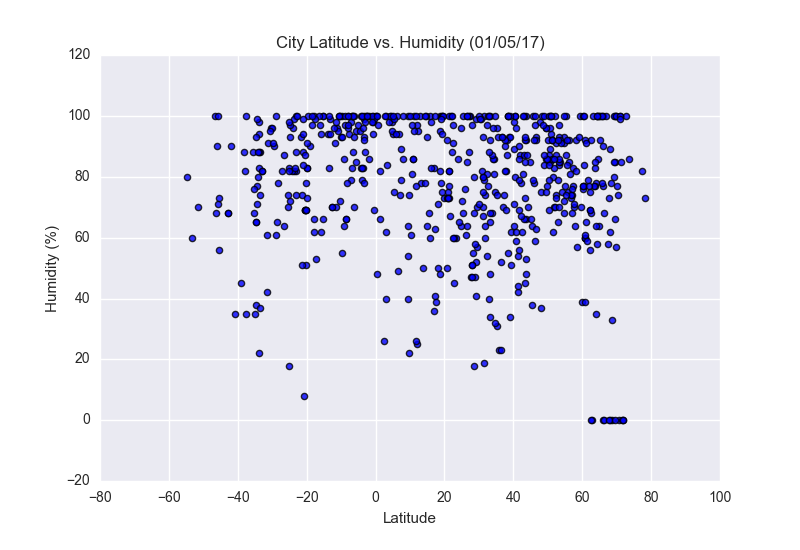
Humidity Map

Wind Map